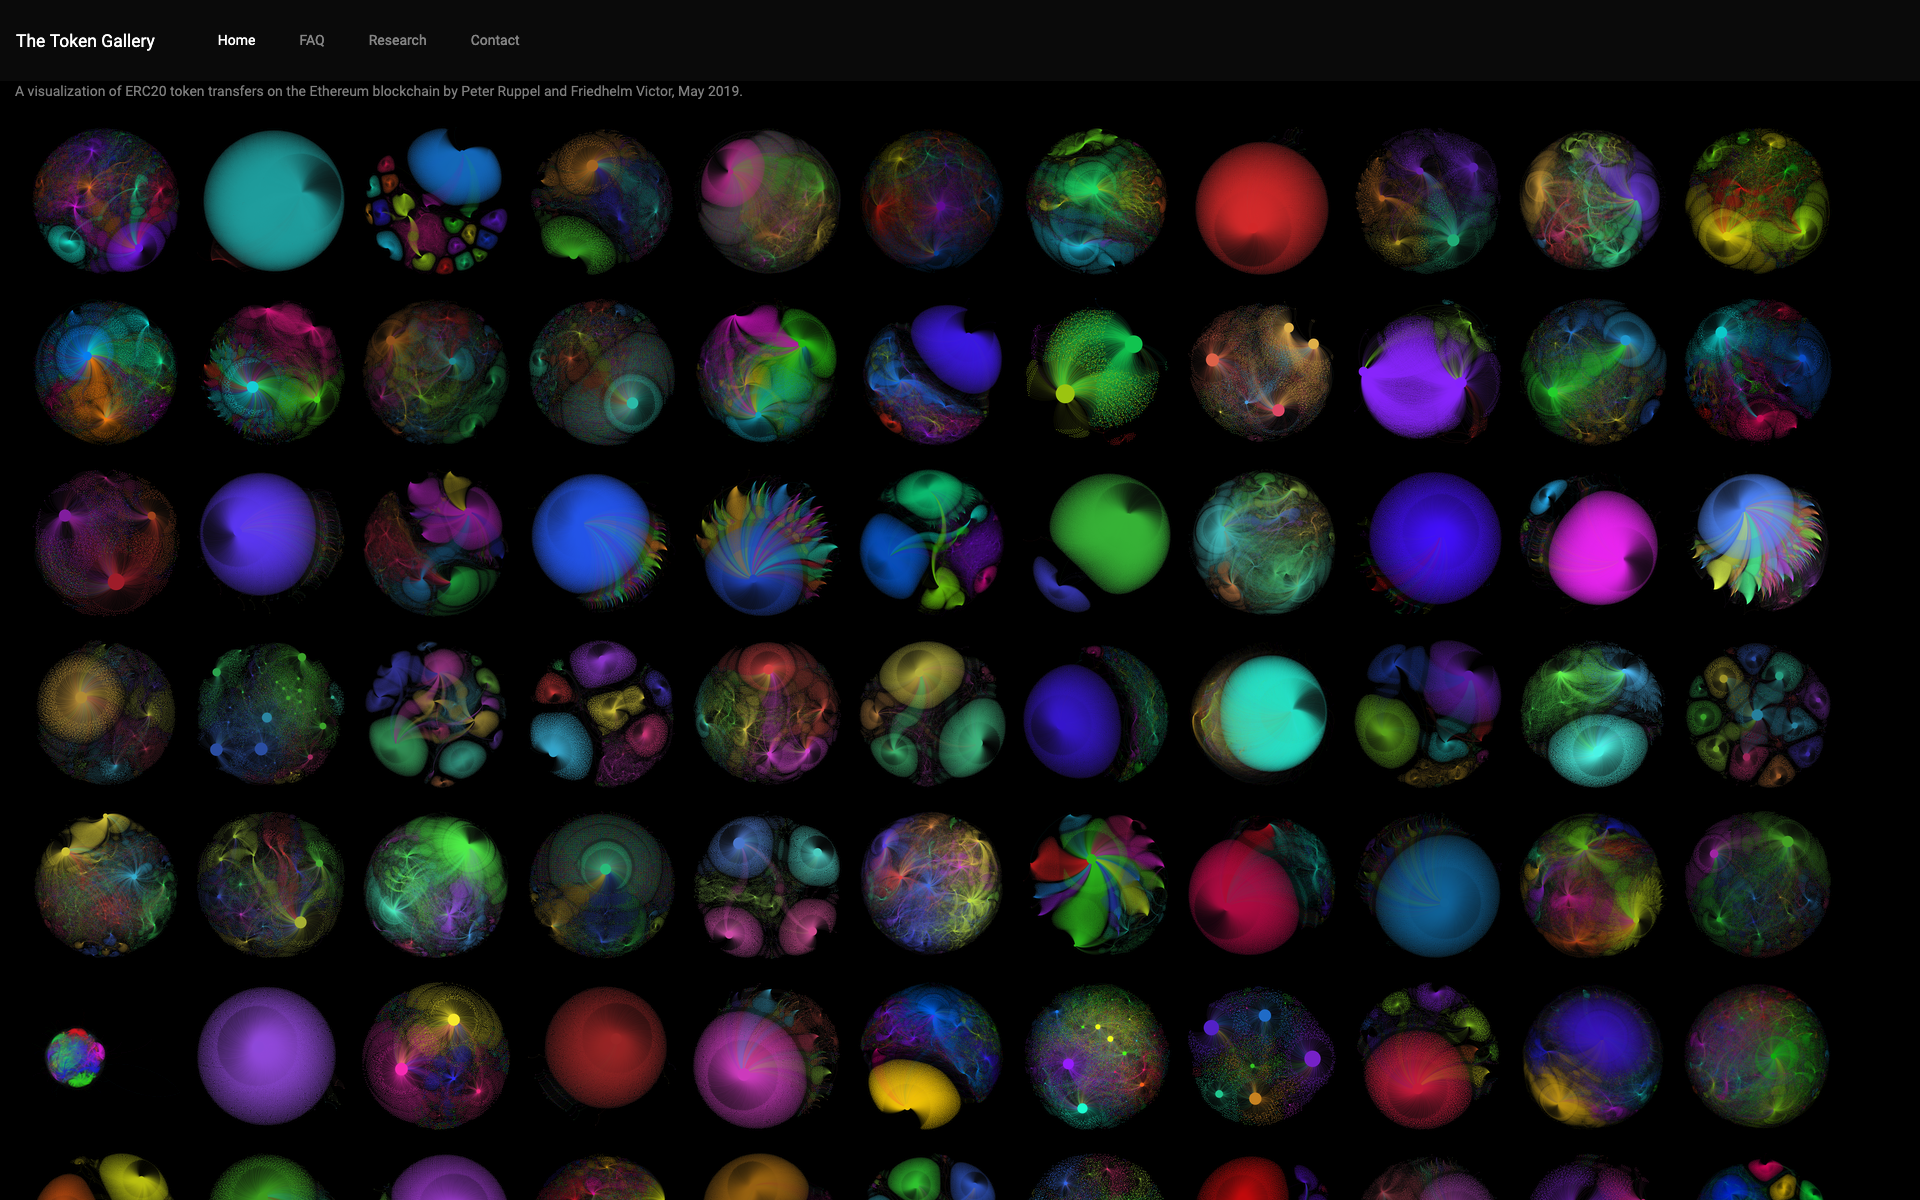
Yesterday, I opened The Token Gallery — a visualization of ERC20 token transfers on the Ethereum blockchain. You can witness completely new and previously unknown network structures that emerge from the actual usage of tokens:
This project was done in collaboration with my colleague Friedhelm Victor at Technische Universität Berlin / Telekom Innovation Laboratories, who did a tremendous job in extracting all the token transfer events from our Ethereum full node. This operation alone has become a great challenge, given the sheer size of operating an Ethereum full node these days: our Parity client is now at 2.6TB and it runs with pruning="archive", tracing="on", and fat_db="on" on a Dell PowerEdge 540 server since 2017.
During our research on token networks, we've found various similarities among the usage of different tokens. The Token Gallery is our attempt to visualize some of these patterns in an intuitive and tangible way.
The Token Gallery is now open 24/7 at:
Currently, the gallery shows about 1.000 of the most actively used ERC20 tokens until September 2018 (a newer dataset will be available very soon). For each token, all its corresponding transfer events are visualized by a two-dimensional embedding of the underlying transactional network. Each Ethereum address is represented by a circular dot (called "node" in graph terminology), and a line between two addresses (called "edge" in graph terminology) indicates that at least one token was transferred between them. The radius of a node indicates its degree, i.e., the bigger a node appears, the more it has had token transfers with many other nodes.
A random example: the transfer network of the RUFF token, contract address 0xf278c1ca969095ffddded020290cf8b5c424ace2, looks like this:
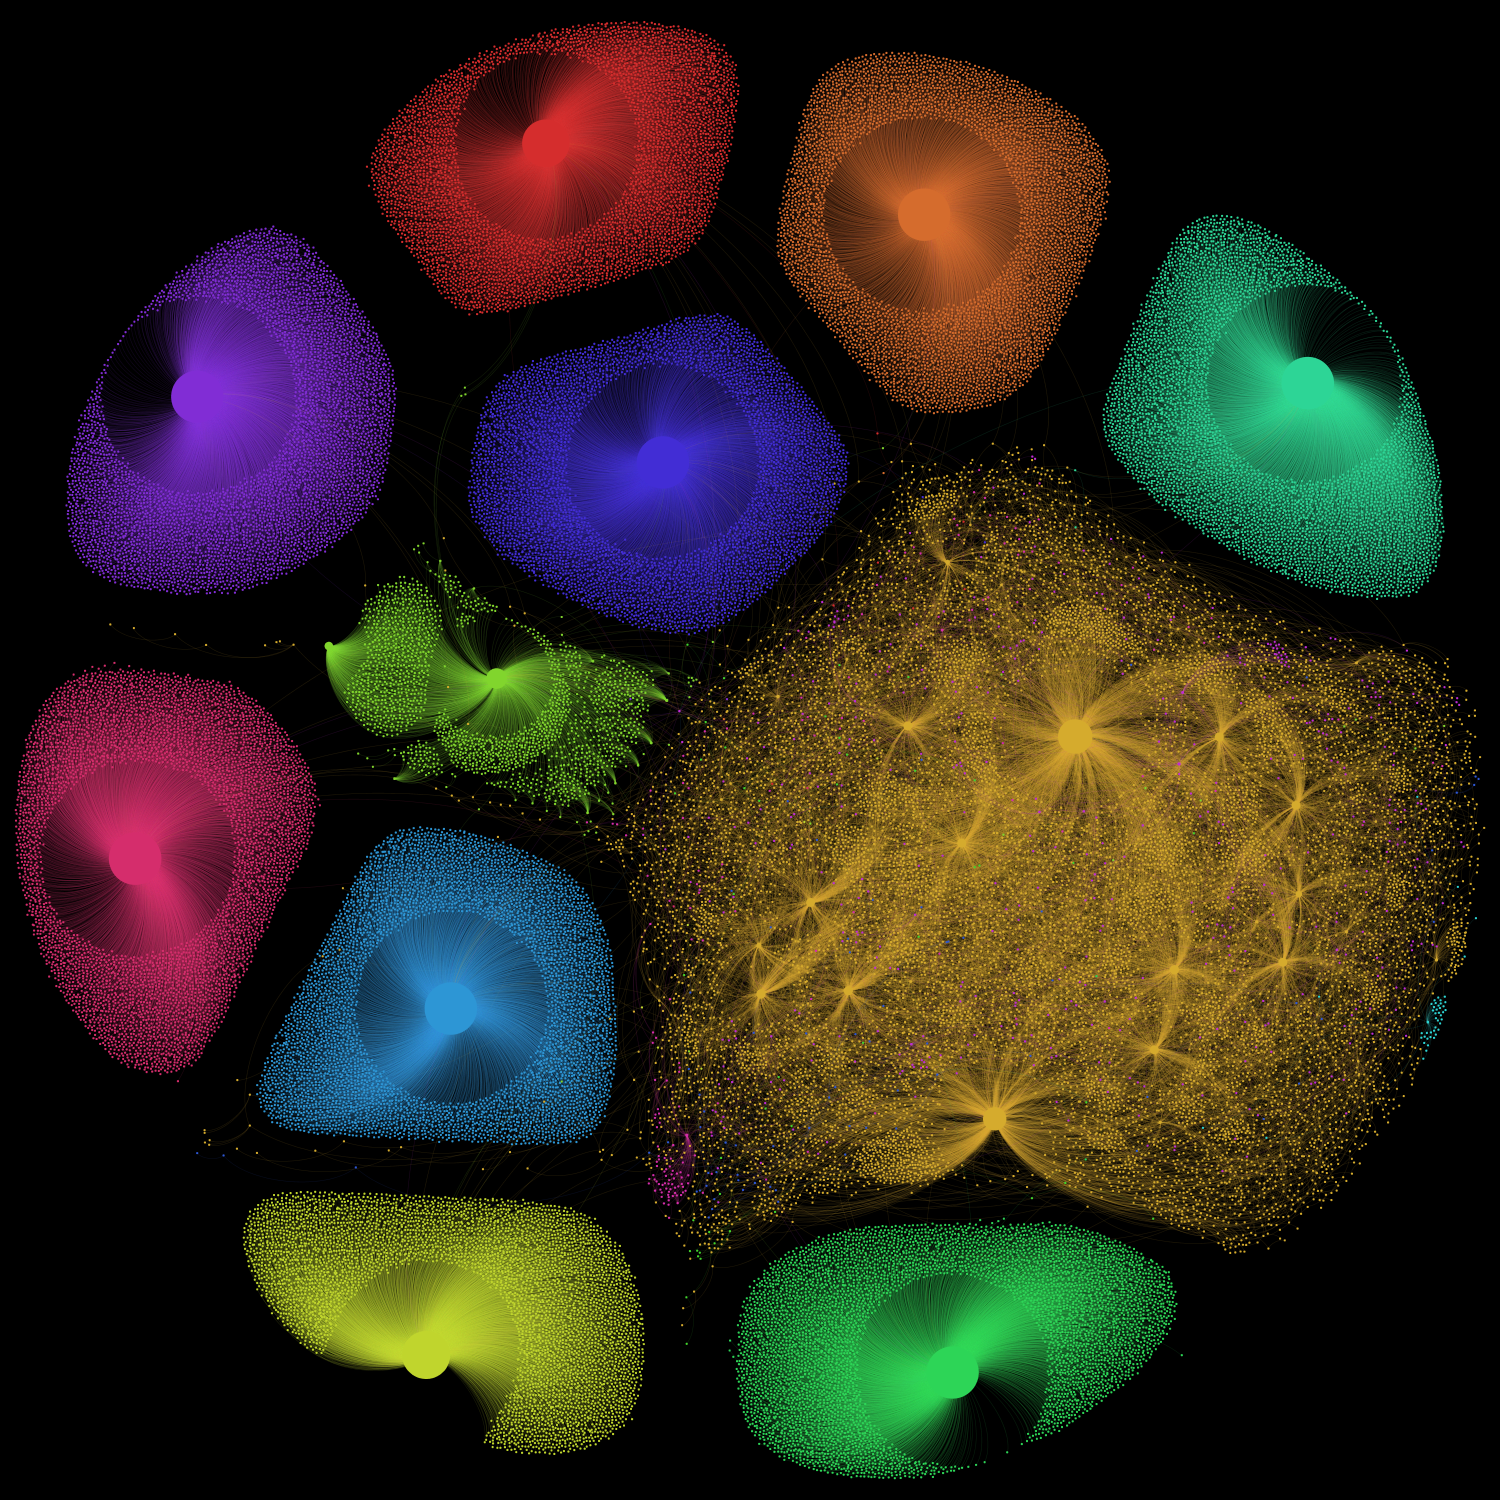
The positions of the nodes have been calculated by means of the ForceAtlas2 algorithm, which uses a force-based approach to assign x,y-coordinates to every node. The circular layout of each network results from applying a rather strong gravitational force when calculating the positions.
The colors in these networks indicate potential communities of addresses on the basis of the Louvain method. The Louvain method identifies groups of nodes that tend to have a higher-than-usual number of transactions with other members of the group than with the rest of the network. However, it is important to say that the resulting grouping of Ethereum addresses is not a final assessment at all. The colors should rather be considered as a visual guideline for exploring the structures of the underlying networks.
Many different great open-source tools have been used for creating this gallery — most notably the awesome Gephi platform, R, Python, Dask, and Sigal. Many thanks to the makers of these projects!
When opening a particular token network in The Token Gallery, you can also follow the link behind the contract address to look up some more information on etherscan.io.
This is an overview of the 945 token networks that are currently shown:
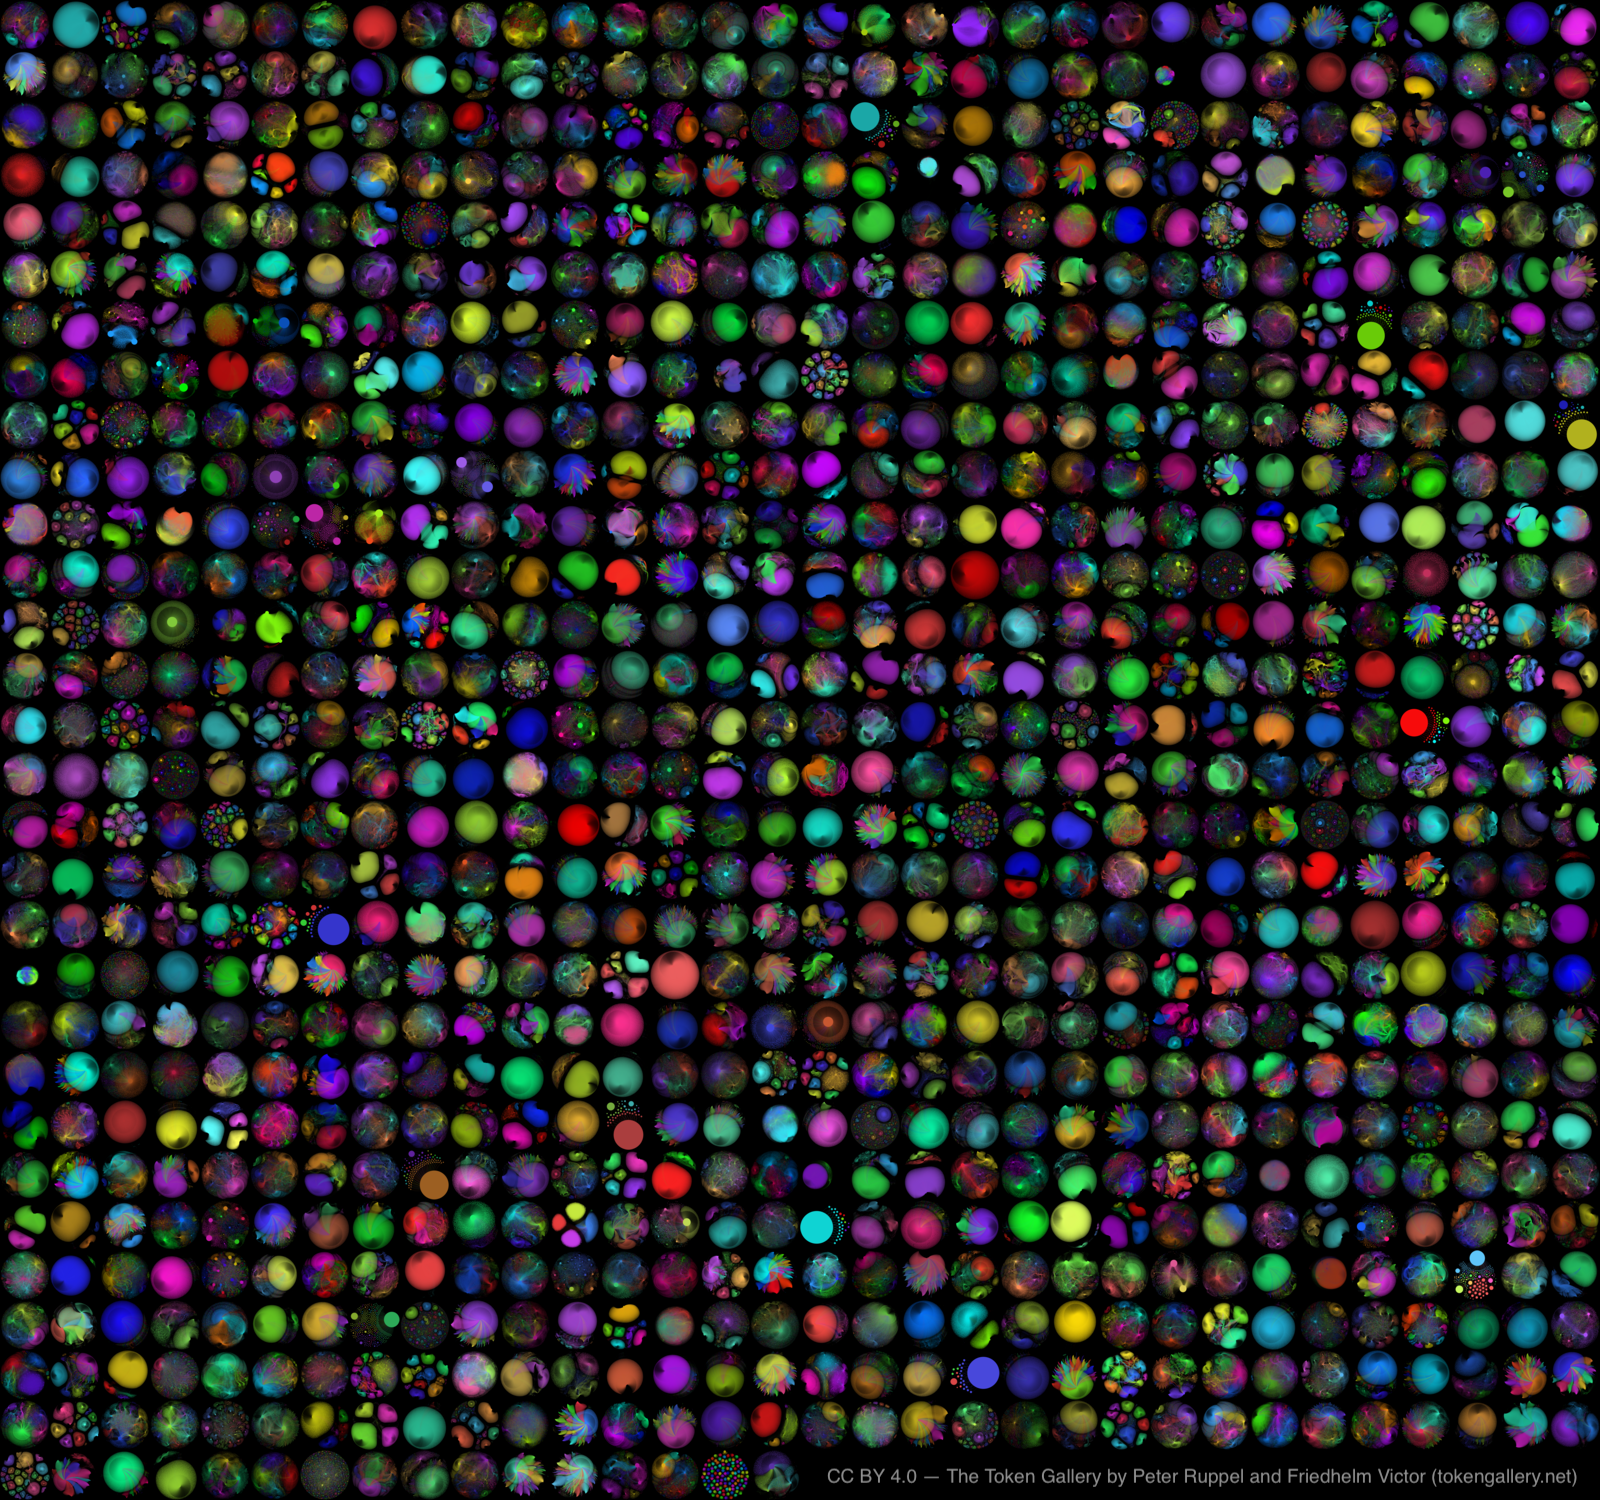
Just by looking at the token networks from a bird's eyes view, one can already see some patterns emerging, for example, extremely star-shaped networks, fractal structures, cascading patterns, dense local communities etc.
While some of these patterns can be easily explained, for example, by Airdrops or Initial Coin Offerings (ICOs), other structures will need to be investigated more closely in the future — for instance, there are some interesting patterns related to networks that implement token burning.
This is the very first version and more features are planned for the near future, for example, search/filter functions and more meta data. Stay tuned.
Feel free to use the pictures — all material in The Token Gallery is licensed under an Attribution 4.0 International (CC BY 4.0) license. Please use the following attribution: CC BY 4.0 — The Token Gallery by Peter Ruppel and Friedhelm Victor (tokengallery.net)
If you happen to be in Berlin (Europe) and also enjoy working on Distributed Ledger Analytics, then let’s have a coffee. Ping me at @peterruppel or https://www.linkedin.com/in/peterruppel